This function samples a simple Stochastic Block Models, with various model for the distribution of the edges: Bernoulli, Poisson, or Gaussian models, and possibly with covariates
Arguments
- nbNodes
number of nodes in the network
- blockProp
parameters for block proportions
- connectParam
list of parameters for connectivity with a matrix of means 'mean' and an optional matrix of variances 'var', the sizes of which must match
blockProplength- model
character describing the model for the relation between nodes (
'bernoulli','poisson','gaussian', ...). Default is'bernoulli'.- directed
logical, directed network or not. Default is
FALSE.- dimLabels
an optional list of labels for each dimension (in row, in column)
- covariates
a list of matrices with same dimension as mat describing covariates at the edge level. No covariate per Default.
- covariatesParam
optional vector of covariates effect. A zero length numeric vector by default.
Value
an object with class SimpleSBM
Examples
### =======================================
### SIMPLE BINARY SBM (Bernoulli model)
## Graph parameters
nbNodes <- 90
blockProp <- c(.5, .25, .25) # group proportions
means <- diag(.4, 3) + 0.05 # connectivity matrix: affiliation network
# In Bernoulli SBM, parameters is a list with a
# matrix of means 'mean' which are probabilities of connection
connectParam <- list(mean = means)
## Graph Sampling
mySampler <- sampleSimpleSBM(nbNodes, blockProp, connectParam, model = 'bernoulli')
plot(mySampler)
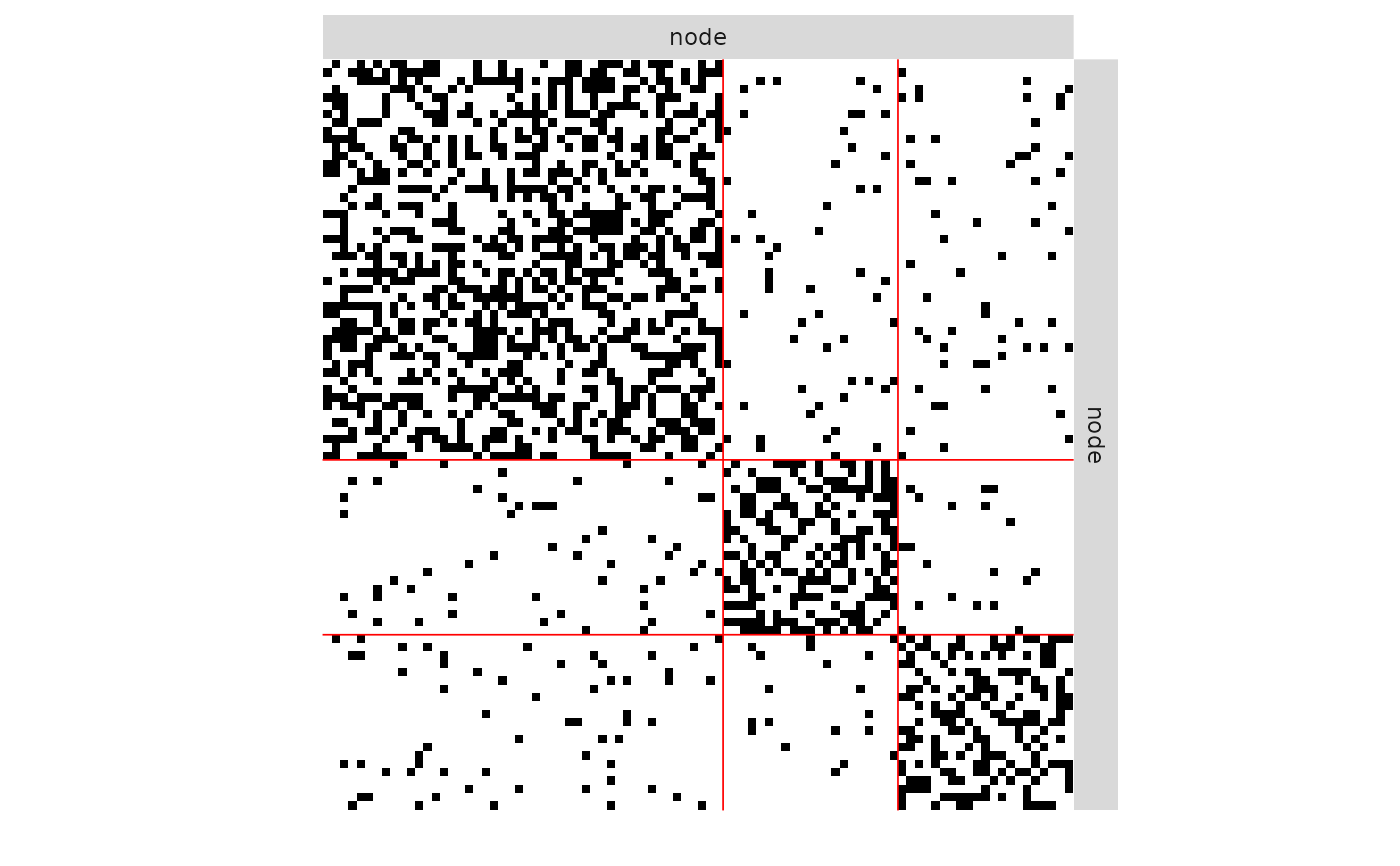 plot(mySampler)
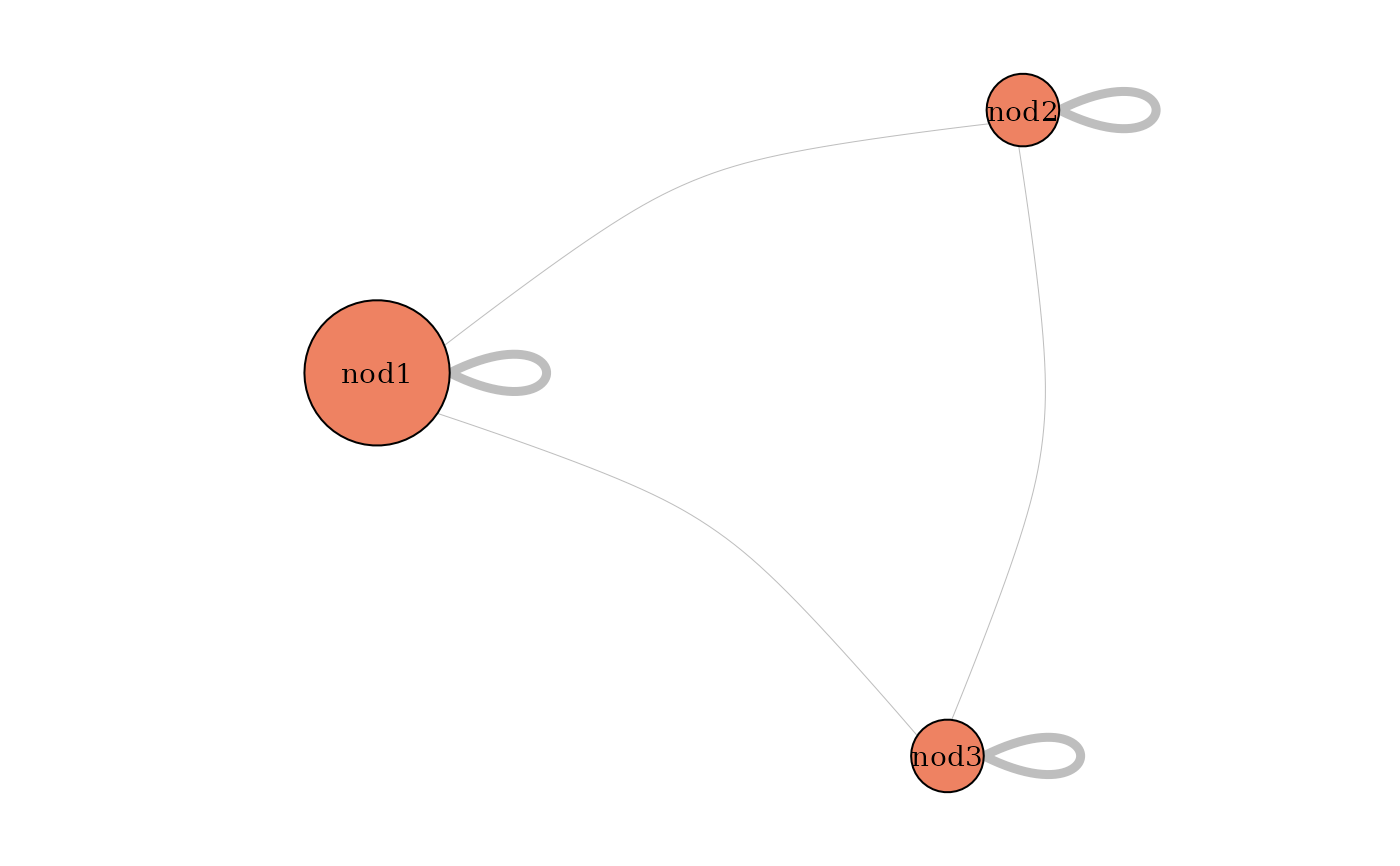
 plot(mySampler,type='meso')
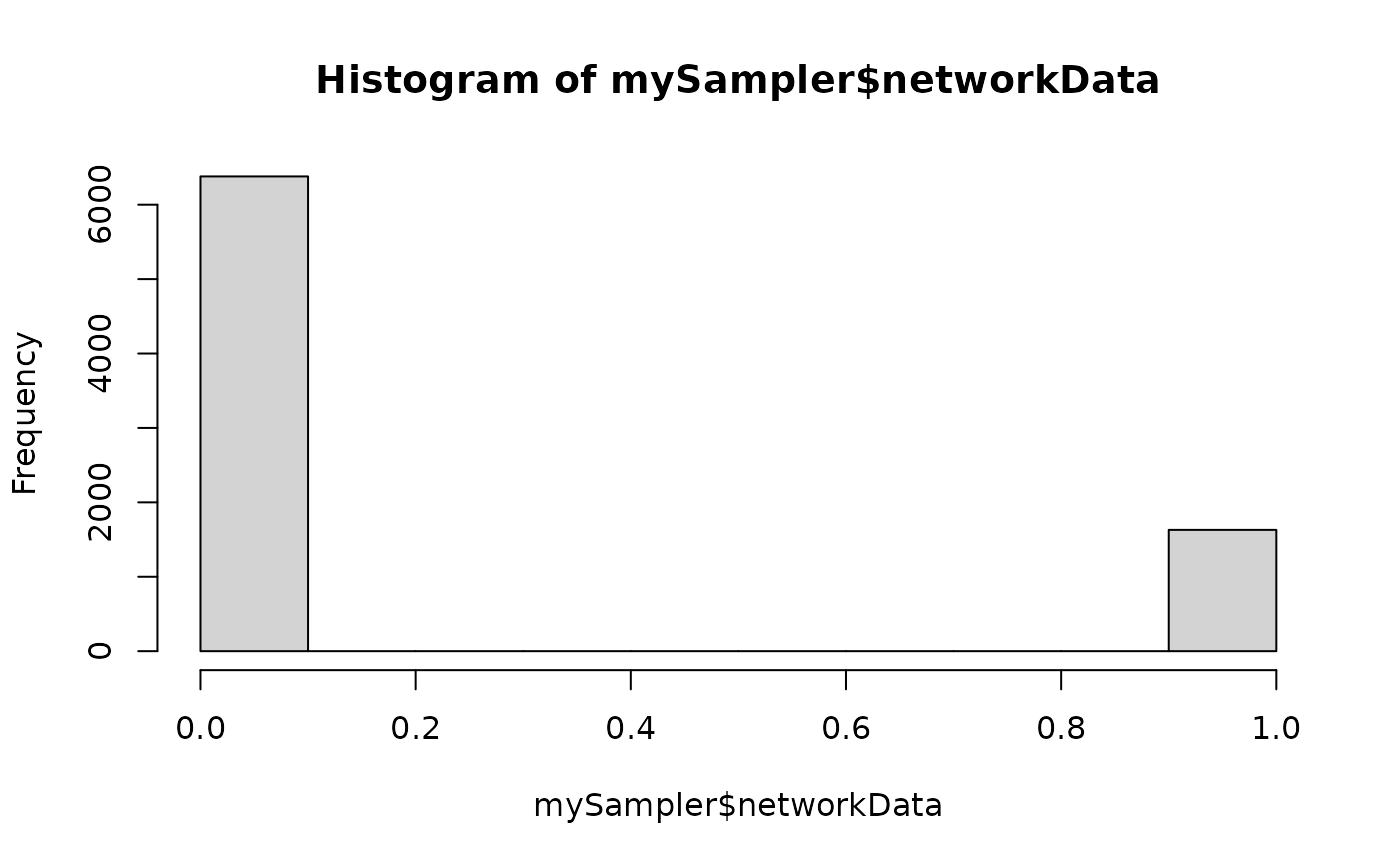
 hist(mySampler$networkData)
 ### =======================================
### SIMPLE POISSON SBM
## Graph parameters
nbNodes <- 90
blockProp <- c(.5, .25, .25) # group proportions
means <- diag(15., 3) + 5 # connectivity matrix: affiliation network
# In Poisson SBM, parameters is a list with
# a matrix of means 'mean' which are a mean integer value taken by edges
connectParam <- list(mean = means)
## Graph Sampling
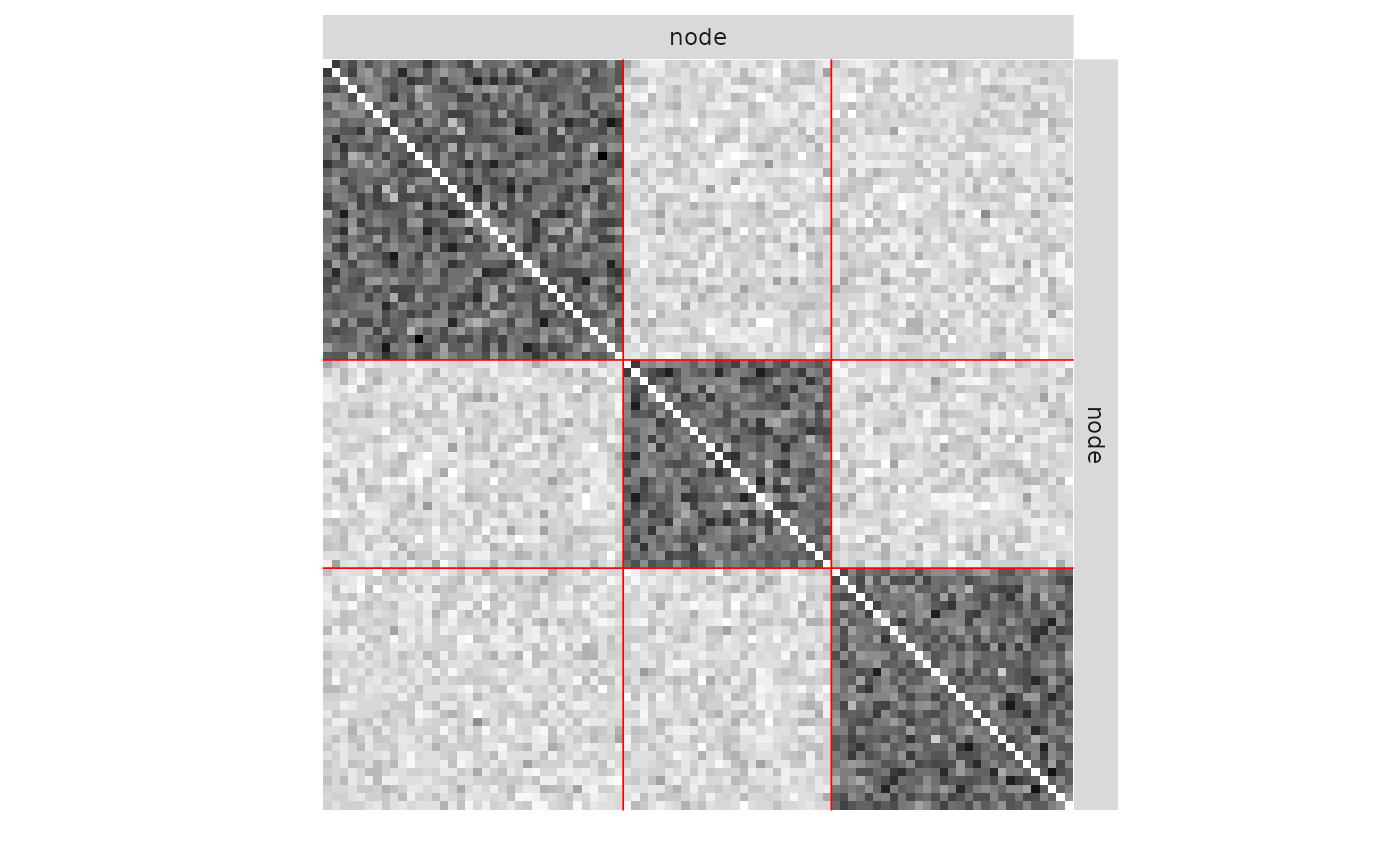
mySampler <- sampleSimpleSBM(nbNodes, blockProp, list(mean = means), model = "poisson")
plot(mySampler)
### =======================================
### SIMPLE POISSON SBM
## Graph parameters
nbNodes <- 90
blockProp <- c(.5, .25, .25) # group proportions
means <- diag(15., 3) + 5 # connectivity matrix: affiliation network
# In Poisson SBM, parameters is a list with
# a matrix of means 'mean' which are a mean integer value taken by edges
connectParam <- list(mean = means)
## Graph Sampling
mySampler <- sampleSimpleSBM(nbNodes, blockProp, list(mean = means), model = "poisson")
plot(mySampler)
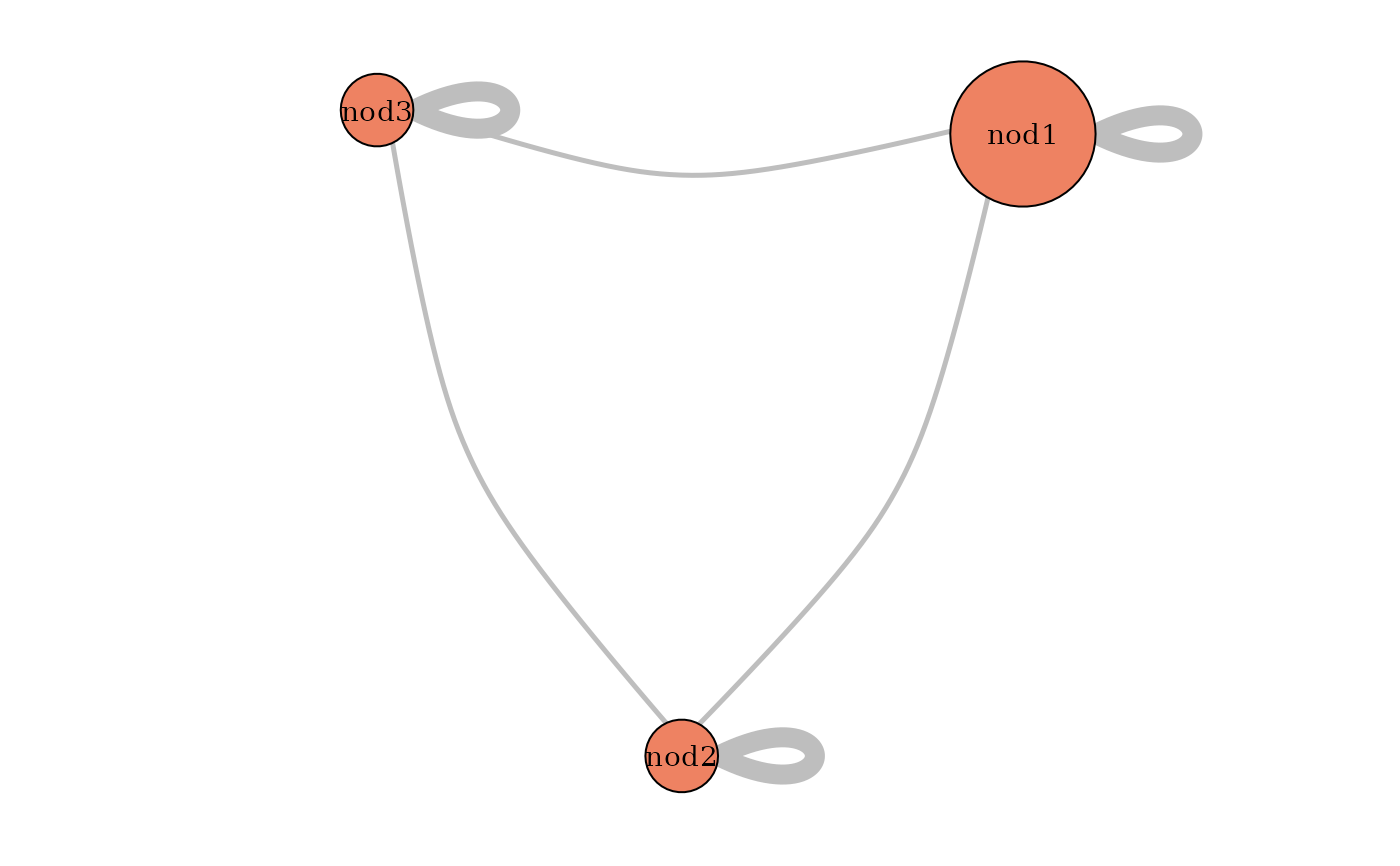
 plot(mySampler,type='meso')
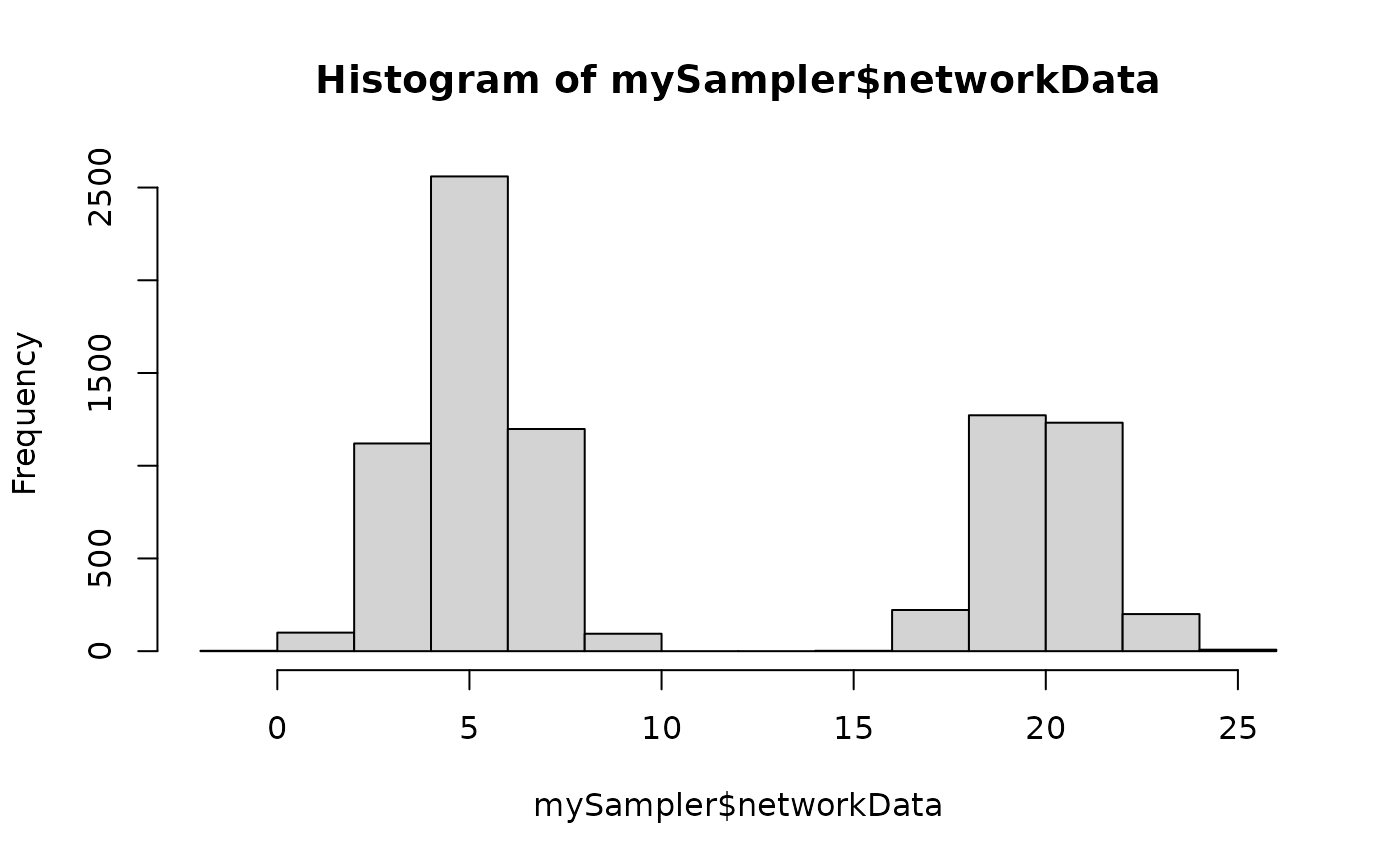
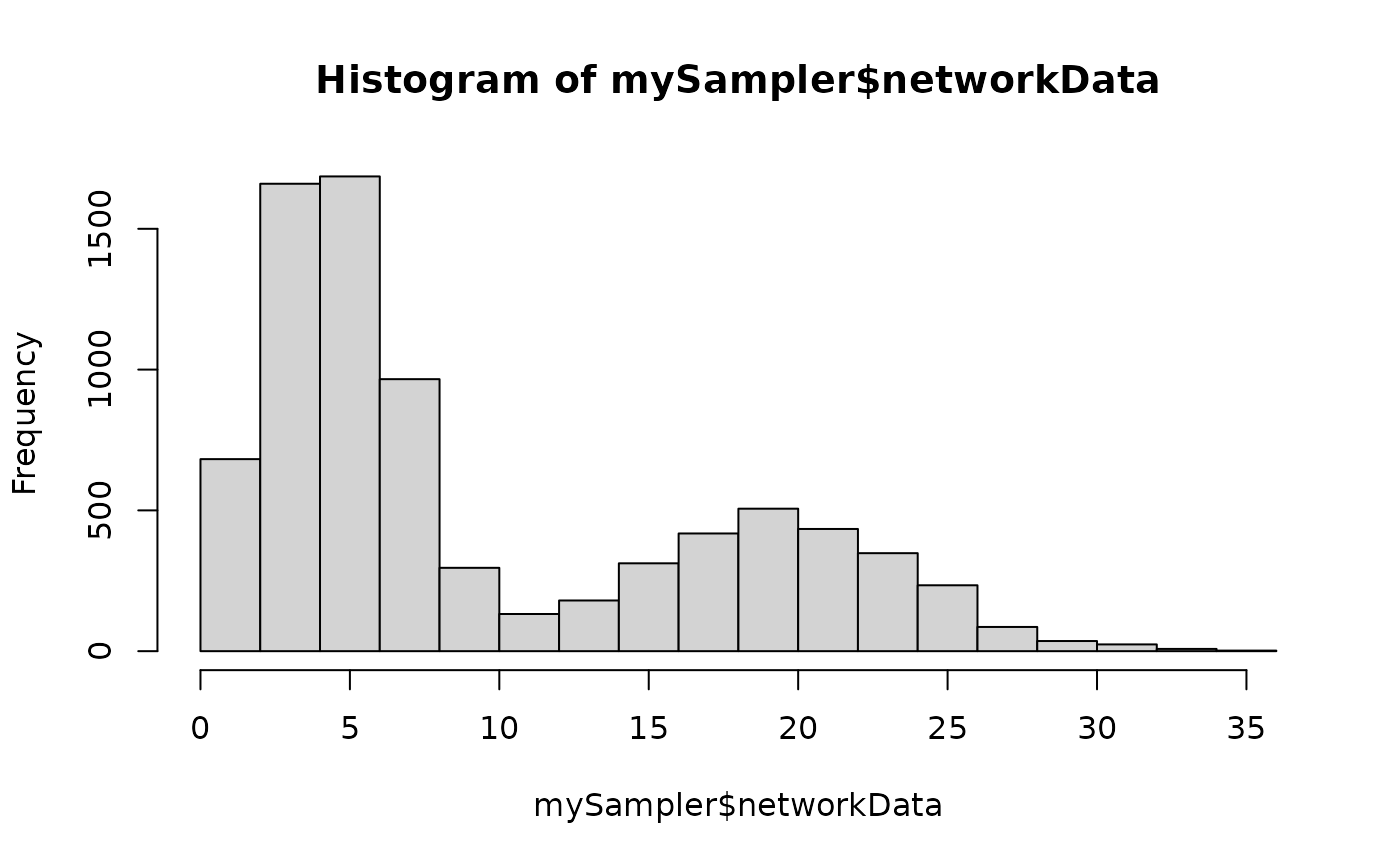
 hist(mySampler$networkData)
 ### =======================================
### SIMPLE GAUSSIAN SBM
## Graph parameters
nbNodes <- 90
blockProp <- c(.5, .25, .25) # group proportions
means <- diag(15., 3) + 5 # connectivity matrix: affiliation network
# In Gaussian SBM, parameters is a list with
# a matrix of means 'mean' and a matrix of variances 'var'
connectParam <- list(mean = means, var = 2)
## Graph Sampling
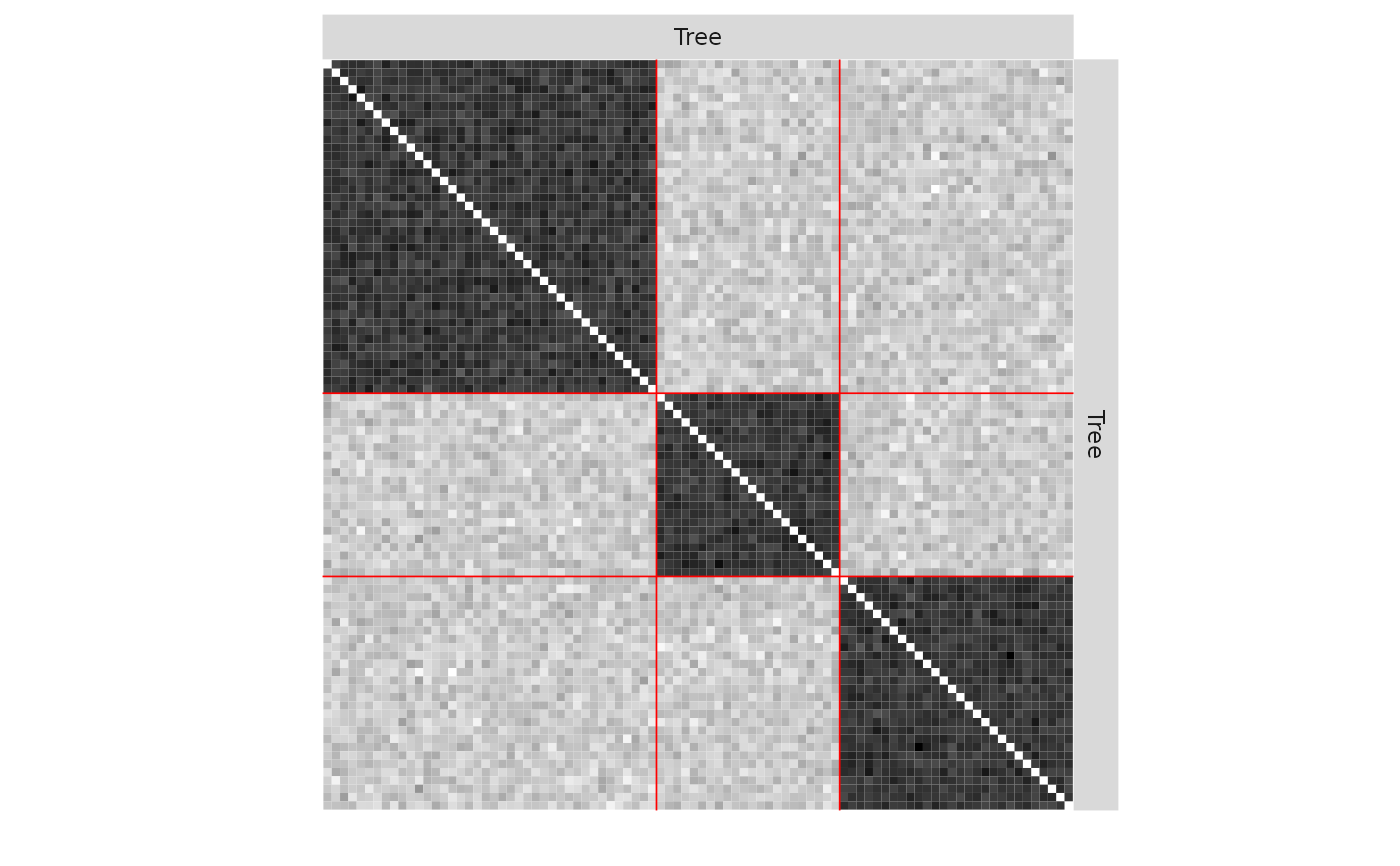
mySampler <- sampleSimpleSBM(nbNodes, blockProp, connectParam, model = "gaussian",dimLabels='Tree')
plot(mySampler)
### =======================================
### SIMPLE GAUSSIAN SBM
## Graph parameters
nbNodes <- 90
blockProp <- c(.5, .25, .25) # group proportions
means <- diag(15., 3) + 5 # connectivity matrix: affiliation network
# In Gaussian SBM, parameters is a list with
# a matrix of means 'mean' and a matrix of variances 'var'
connectParam <- list(mean = means, var = 2)
## Graph Sampling
mySampler <- sampleSimpleSBM(nbNodes, blockProp, connectParam, model = "gaussian",dimLabels='Tree')
plot(mySampler)
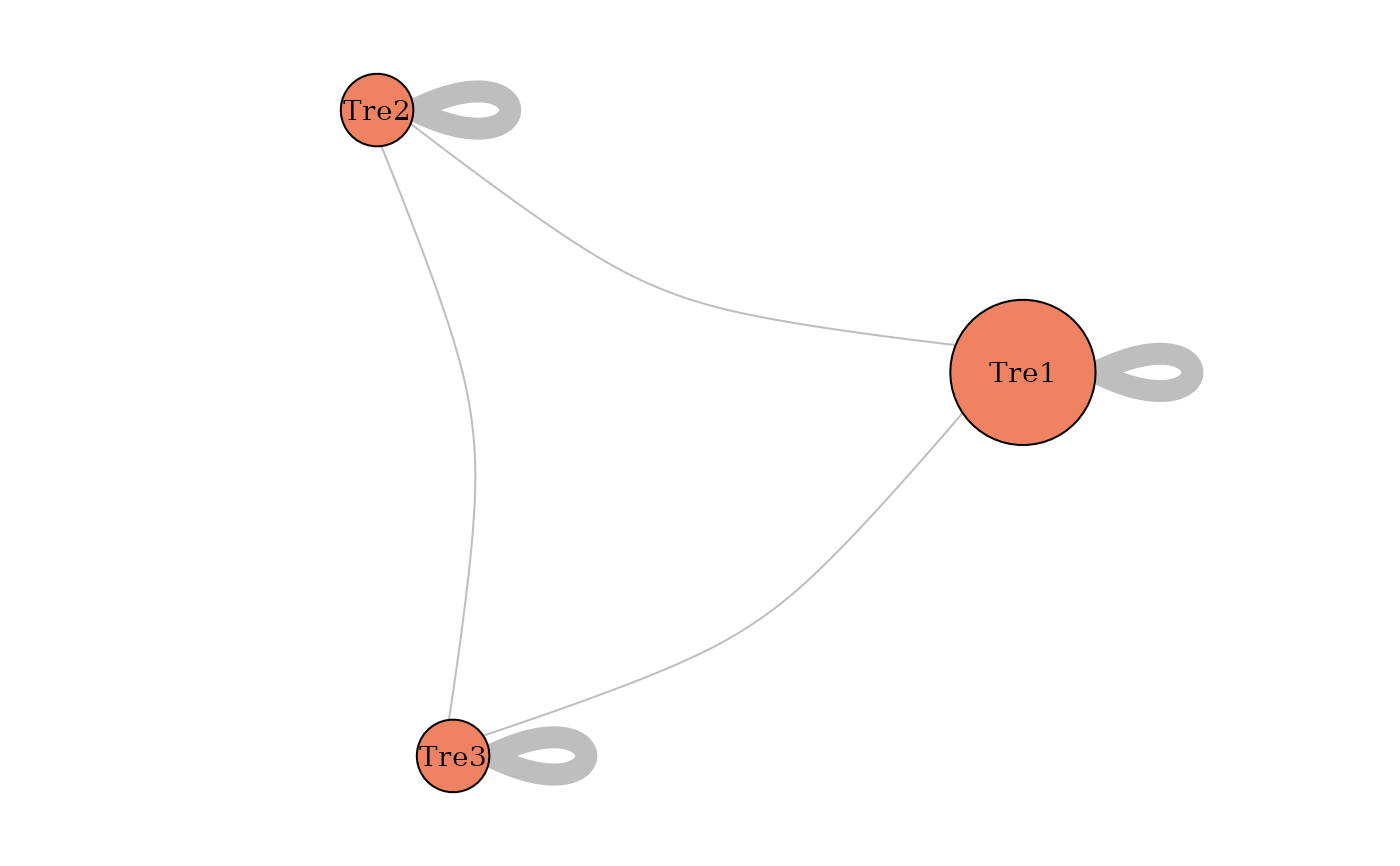
 plot(mySampler,type='meso')
 hist(mySampler$networkData)