Plot the matrices corresponding to a Multipartite Network
Source:R/plotMyMultipartiteMatrix.R
plotMyMultipartiteMatrix.RdPlot the matrices corresponding to a Multipartite Network
plotMyMultipartiteMatrix(listSBM, memberships = NULL, plotOptions = list())Arguments
Value
a ggplot object corresponding to the plot
Details
plotOptions is a list containing the following items
"normalized": Boolean. TRUE if the various matrices are presented in the same scale (between O and 1). FALSE otherwise. Default value FALSE
"compact": Boolean. Default value is TRUE if you ask for the matrices to be transposed to have a more compact view
"legend": Boolean. Set TRUE if you want to see the legend. Default value is FALSE
"legend.title": Boolean. Set TRUE if you want to print the title of the legend. Default value is FALSE
"legend.position": Position of the legend. Possible values are 'bottom', 'top','left,'right'. Default value is 'bottom'
"nodeNames": Set true if the node Names must be plotted. Default value is FALSE
"line.color": The color of the lines to separate groups. Default value is red
"line.width": Width of the lines to separate groups. Default value is NULL, automatically chosen
"title": Title of the plot. Default value is NULL
Examples
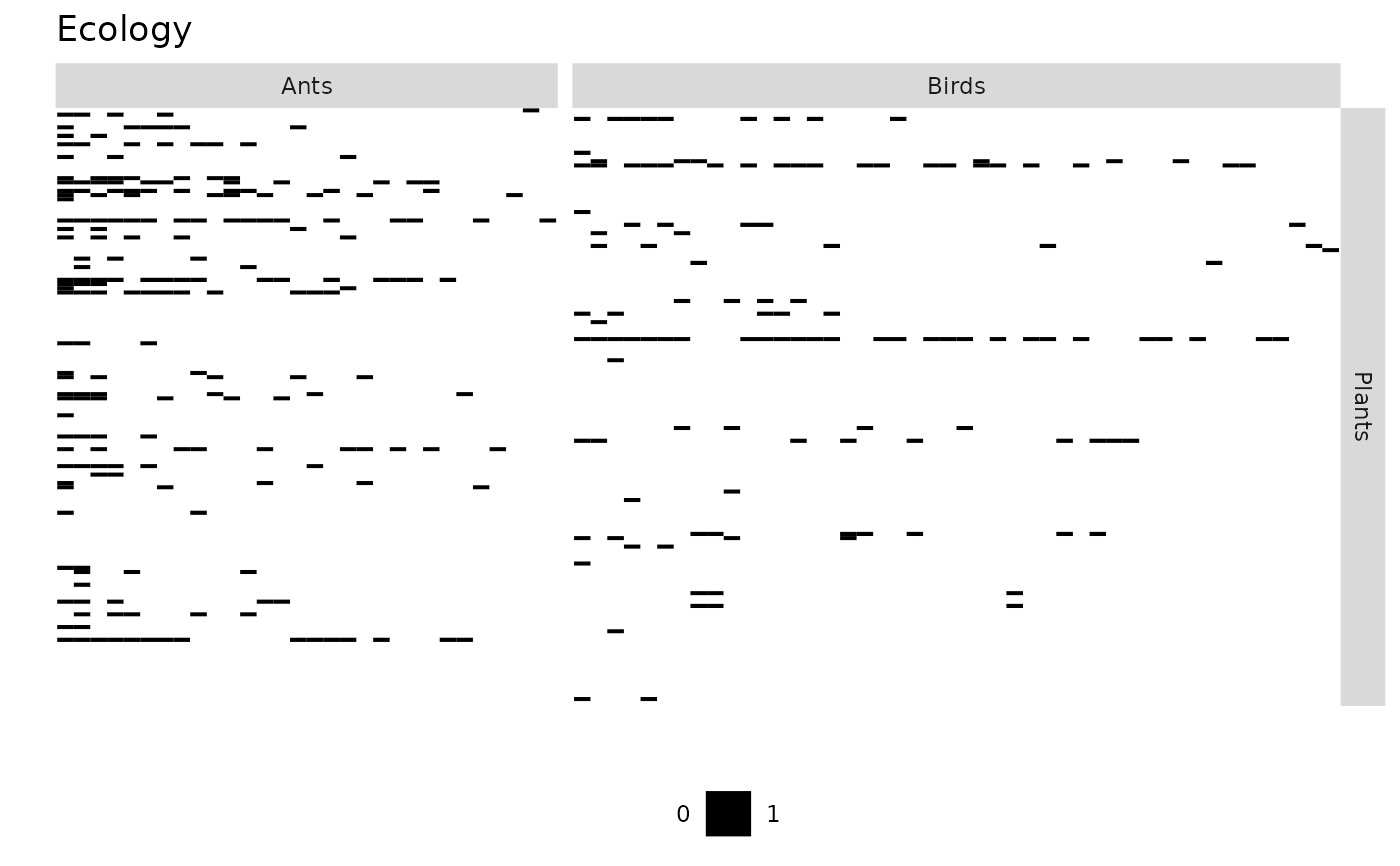
data("multipartiteEcologicalNetwork")
Net <- multipartiteEcologicalNetwork
type='bipartite'
model = 'bernoulli'
directed = FALSE
listNet <- list()
listNet[[1]] = defineSBM(Net$Inc_plant_ant,
model,type,directed,
dimLabels = c(row = "Plants", col = "Ants"))
listNet[[2]] = defineSBM(Net$Inc_plant_bird,model,type,directed,
dimLabels =c(row = "Plants",col = "Birds"))
plotMyMultipartiteMatrix(listNet,plotOptions=list(legend = TRUE,title='Ecology'))
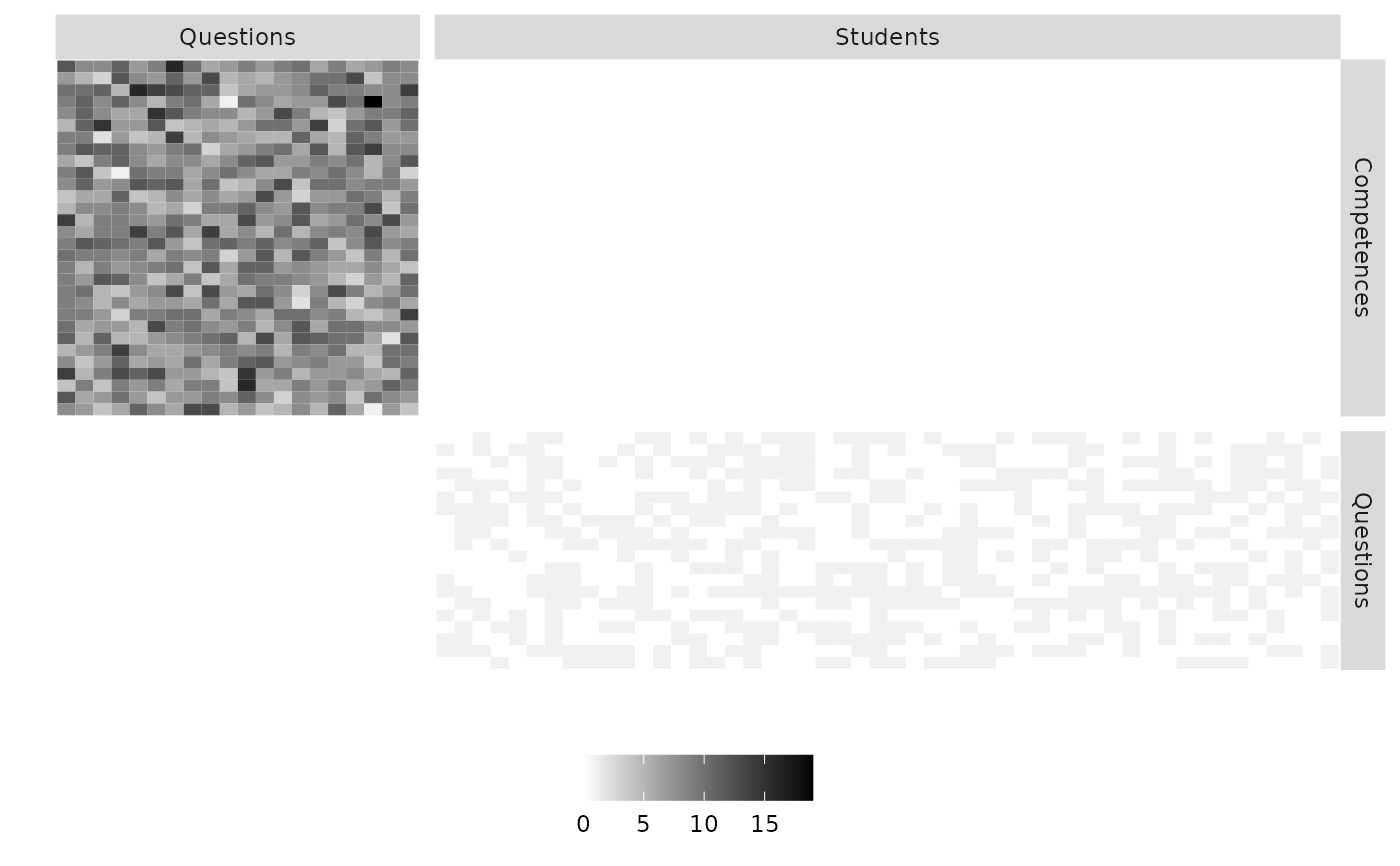
 listNet <- list()
listNet[[1]] <- defineSBM(matrix(rbinom(1000,1,0.5),20,50),
model = 'bernoulli',
type ='bipartite', directed = NA,
dimLabels = c(row="Questions",col="Students"))
listNet[[2]] <- defineSBM(matrix(rpois(20*30,8),30,20),
model = 'poisson',
type ='bipartite',directed = NA,
dimLabels = c(row="Competences",col="Questions"))
plotMyMultipartiteMatrix(listNet,plotOptions=list(legend = TRUE,compact = FALSE))
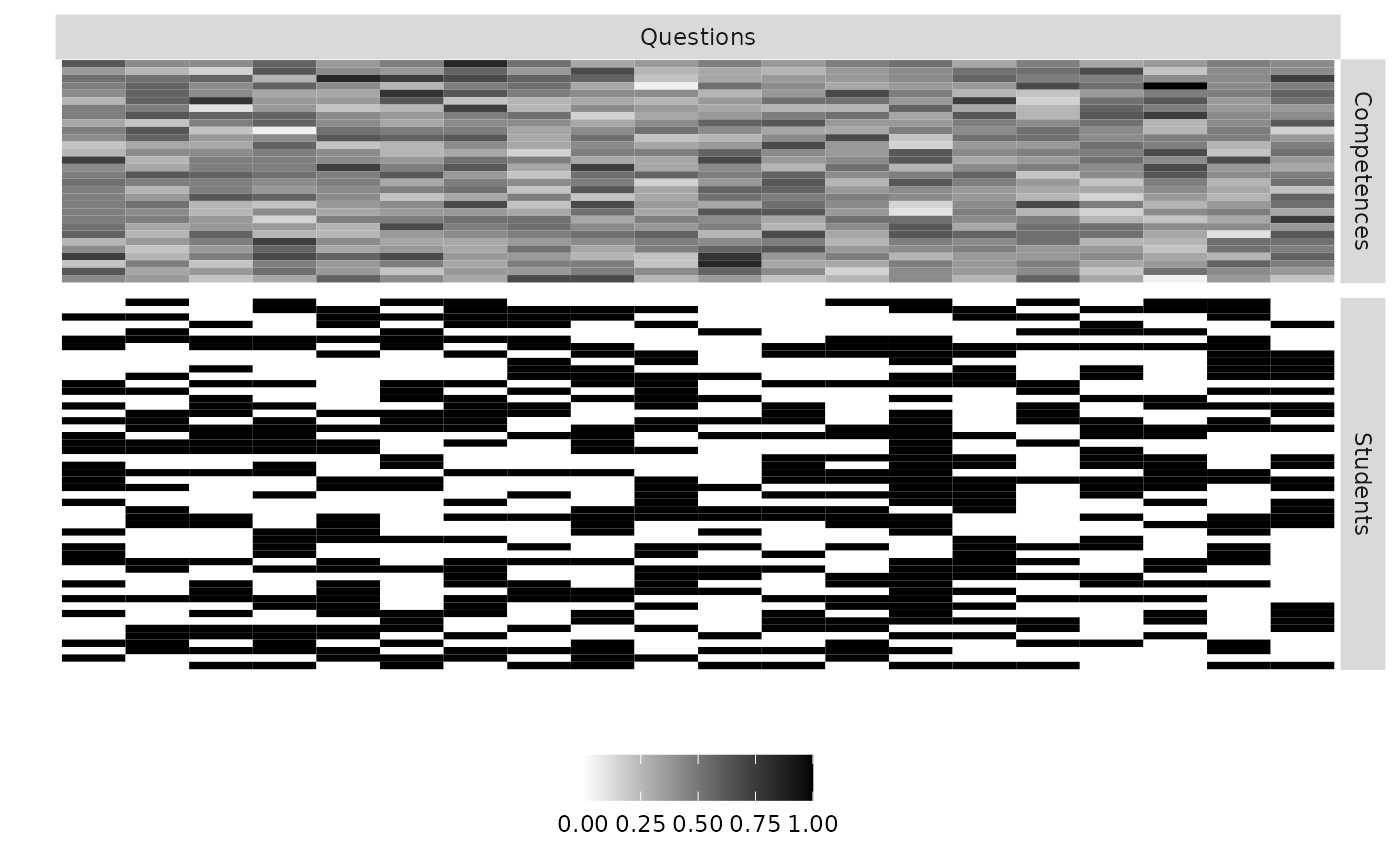
listNet <- list()
listNet[[1]] <- defineSBM(matrix(rbinom(1000,1,0.5),20,50),
model = 'bernoulli',
type ='bipartite', directed = NA,
dimLabels = c(row="Questions",col="Students"))
listNet[[2]] <- defineSBM(matrix(rpois(20*30,8),30,20),
model = 'poisson',
type ='bipartite',directed = NA,
dimLabels = c(row="Competences",col="Questions"))
plotMyMultipartiteMatrix(listNet,plotOptions=list(legend = TRUE,compact = FALSE))
 plotMyMultipartiteMatrix(listNet,plotOptions=list(legend = TRUE,normalized = TRUE))