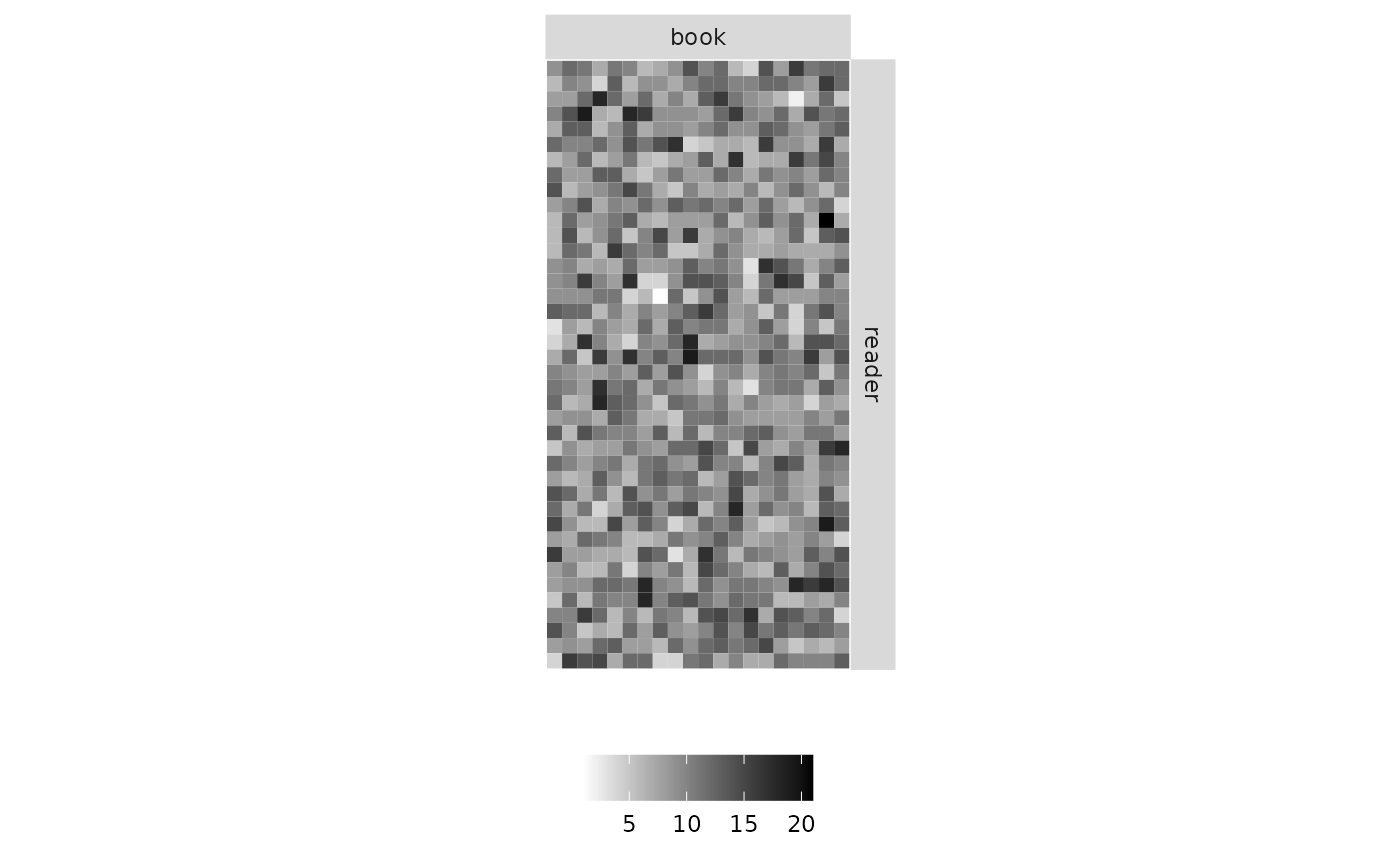
Plot an adjacency or incidence Matrix
plotMyMatrix(
  Mat,
  dimLabels = c(row = "row", col = "col"),
  clustering = NULL,
  plotOptions = NULL
)
Arguments
Value
a ggplot object corresponding to the plot
Details
The list of parameters plotOptions for the matrix plot is
"legend": Boolean. Set TRUE if you want to see the legend. Default value is FALSE
"legend.title": Boolean. Set TRUE if you want to print the title of the legend. Default value is FALSE
"legend.position": Position of the legend. Possible values are 'bottom', 'top','left,'right'. Default value is 'bottom'
"rowNames": Set true if the rownames must be plotted. Default value is FALSE
"colNames": Set true if the colNames must be plotted. Default value is FALSE
"line.color": Chain of character. The color of the lines to separate groups if a clustering is provided. Default value is red
"line.width": Numeric. Width of the lines to separate groups. Default value is NULL, automatically chosen
"title": Chain of character. Title of the plot. Default value is NULL