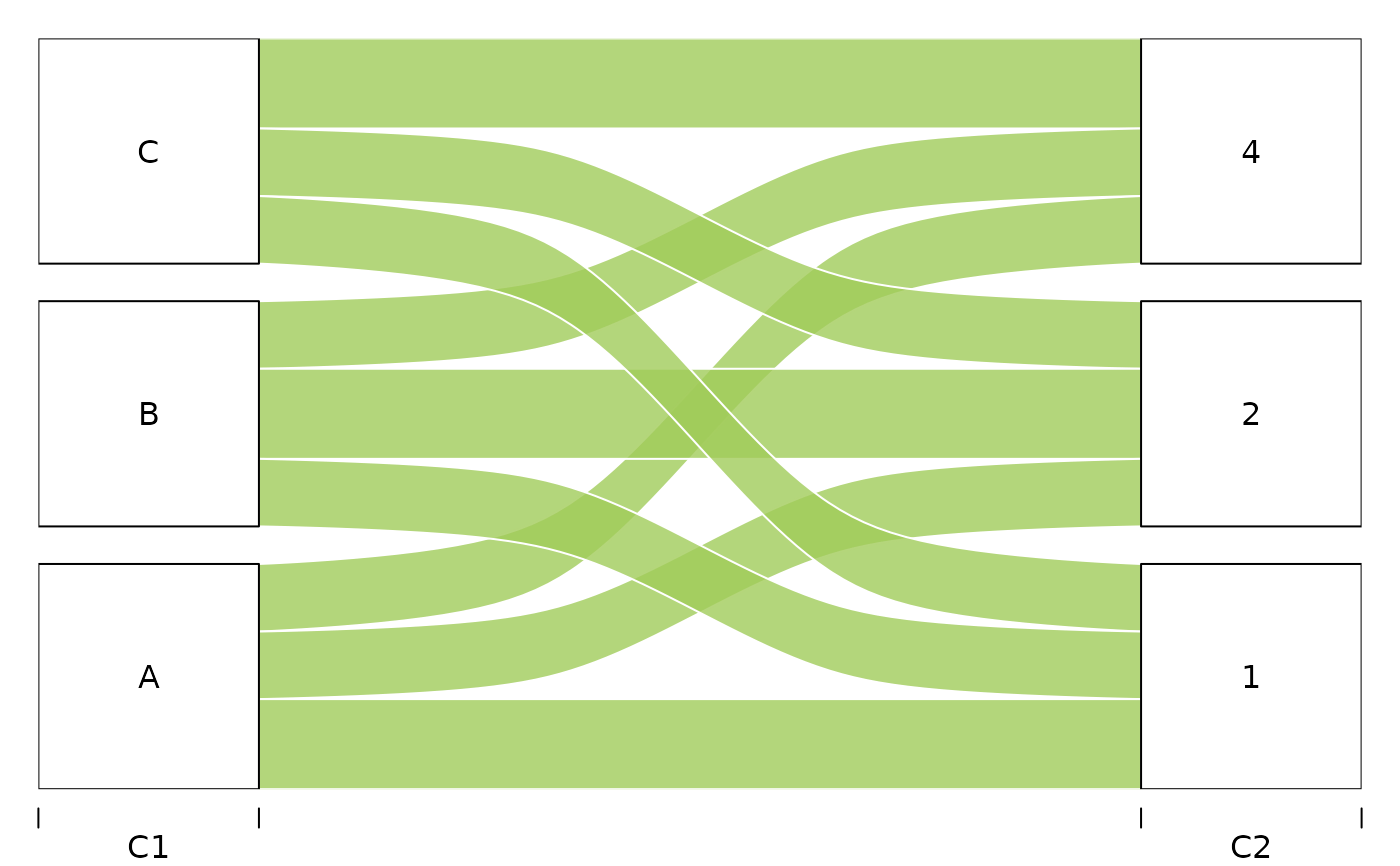
Plot an alluvial plot between clusterings
plotAlluvial(listMemberships, plotOptions = list())Arguments
Value
display the alluvial plot, returns the plotOptions as a list
Details
The list of parameters plotOptions provides the following options
"curvy" numeric, controls the curvature of the alluvial. Default value = 0.3
"alpha numeric, vector of transparency of the stripes. Default value = 0.8
"gap.width" numeric, relative width of inter-category gaps. Default value = 0.1
"col" vector of colors of the stripes. Default value = "darkolivegreen3"
"border" vector of border colors for the stripes. Default is white
Examples
listMemberships <- list(C1 = rep(c('A','B','C'),each=10),C2 = rep(c(1,2,4),10))
plotAlluvial(listMemberships)
 #> $plotOptions
$curvy
#> [1] 0.3
#>
#> $plotOptions$alpha
#> [1] 0.8
#>
#> $plotOptions$gap.width
#> [1] 0.1
#>
#> $plotOptions$col
#> [1] "darkolivegreen3"
#>
#> $plotOptions$border
#> [1] "white"
#>
#>
#> $tableFreq
#> C1 C2 Freq
#> 1 A 1 4
#> 2 B 1 3
#> 3 C 1 3
#> 4 A 2 3
#> 5 B 2 4
#> 6 C 2 3
#> 7 A 4 3
#> 8 B 4 3
#> 9 C 4 4
#>
#> $plotOptions
#> $plotOptions$curvy
#> [1] 0.3
#>
#> $plotOptions$alpha
#> [1] 0.8
#>
#> $plotOptions$gap.width
#> [1] 0.1
#>
#> $plotOptions$col
#> [1] "darkolivegreen3"
#>
#> $plotOptions$border
#> [1] "white"
#>
#>
#> $tableFreq
#> C1 C2 Freq
#> 1 A 1 4
#> 2 B 1 3
#> 3 C 1 3
#> 4 A 2 3
#> 5 B 2 4
#> 6 C 2 3
#> 7 A 4 3
#> 8 B 4 3
#> 9 C 4 4
#>